
oncoReveal®
Myeloid v2 Application Note
Panel Overview
- Number of genes | amplicons: 80 genes | 874 amplicons
- Hotspots in 62 genes; full CDS coverage of 18 genes
- Total panel size: 124.3 kb
- Variant types: SNVs, indels, internal tandem duplications (ITDs)
- Recommended DNA input: 20-60 ng
- Sample types: DNA from whole blood or PBMCs
- Mapping rate: ~98.9%
- Percentage on-target aligned reads: ~87.5%
- Coverage uniformity (% targets with >0.2X mean coverage): ~97.4%
- Recommended reads per sample: ~5.14M paired-end reads (~2.57M clusters)
- Total assay time (from DNA to sequencer): <8.5 hrs
Data characterization and panel performance
Introduction
Myeloid malignancies comprise a diverse group of hematologic neoplasms, including acute myeloid leukemia (AML), myelodysplastic syndromes (MDS), myeloproliferative neoplasms (MPNs), chronic myelomonocytic leukemia (CMML), and related disorders. These diseases are driven by a broad spectrum of clinically relevant genomic alterations that support disease classification, prognostic risk stratification, therapeutic selection, and measurable residual disease assessment. Current clinical guidelines from organizations, such as the WHO, NCCN, and AMP/CAP, increasingly recommend comprehensive molecular profiling across multiple genes and variant classes. As a result, laboratories require genomic assays that can simultaneously detect single nucleotide variants (SNVs), insertions/deletions (indels), and complex alterations such as FLT3 internal tandem duplications (ITDs). These assays must also maintain reliable coverage across technically challenging, GC-rich regions such as CEBPA. Targeted NGS meets this need by consolidating profiling into one assay, reducing specimen use, streamlining workflows, and reducing turnaround time.
The oncoReveal® Myeloid v2 Panel addresses these requirements using Pillar Biosciences’ SLIMamp® multiplex PCR technology. It interrogates 80 myeloid-associated genes, with full CDS for 18 genes, in a single-tube, same-day library preparation workflow, with robust detection of SNVs, indels, and FLT3 ITDs and uniform coverage of challenging regions such as high GC content regions in CEBPA. This application note characterizes sequencing performance, coverage uniformity, analytical sensitivity, variant allele frequency (VAF) accuracy, and FLT3 ITD detection across reference materials and clinical specimens.
Materials and Methods
Panel design and workflow
The oncoReveal Myeloid v2 Panel was developed by expanding and updating the content of the original oncoReveal Myeloid assay. Target selection was guided by review of major myeloid guidelines, including WHO 2016 and 2022, ICC 2022, ELN 2022, and NCCN recommendations. The resulting panel comprises 874 amplicons covering 80 genes associated with myeloid malignancies, including full coding sequence coverage of 18 genes and targeted hotspot coverage of 62 genes (Table 1). The panel is designed to detect SNVs and indels down to ~1% VAF, and FLT3 ITDs from 3 bp to ≥300 bp (upper bound ITD length not estimated) down to ~0.3%.
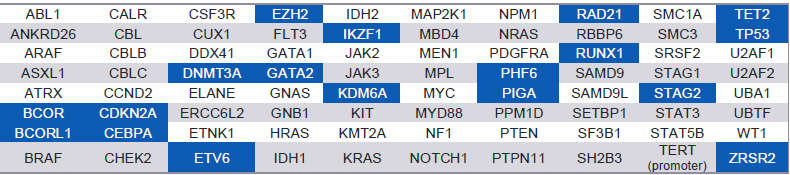
Table 1. Genes covered by the oncoReveal® Myeloid v2 Panel. 18 genes have full CDS coverage (blue), while the remaining have hotspot coverage. FLT3 internal tandem duplications (ITDs) are detected as well.
The oncoReveal Myeloid v2 Panel retains the established workflow used with the previous-generation assay, with minor adjustments in the protocol, minimizing operational changes for laboratories transitioning to the updated panel. Library preparation steps, sequencing configuration, and PiVAT®-based analysis remain closely aligned, allowing existing laboratory infrastructure, operator training, and workflow integration to be leveraged (Figure 1). This compatibility also supports continued use alongside the oncoReveal Heme Fusion Panel, enabling coordinated DNA and RNA testing within a single laboratory process.
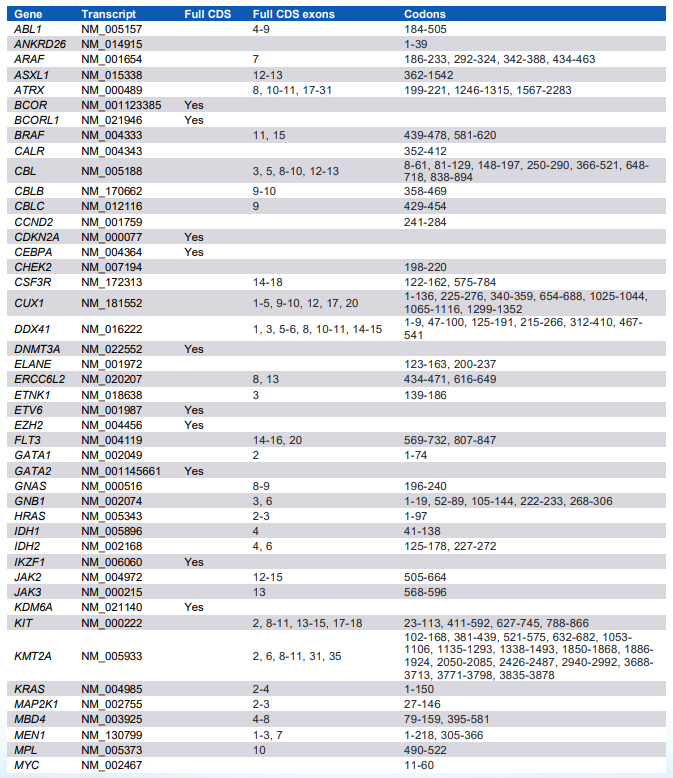
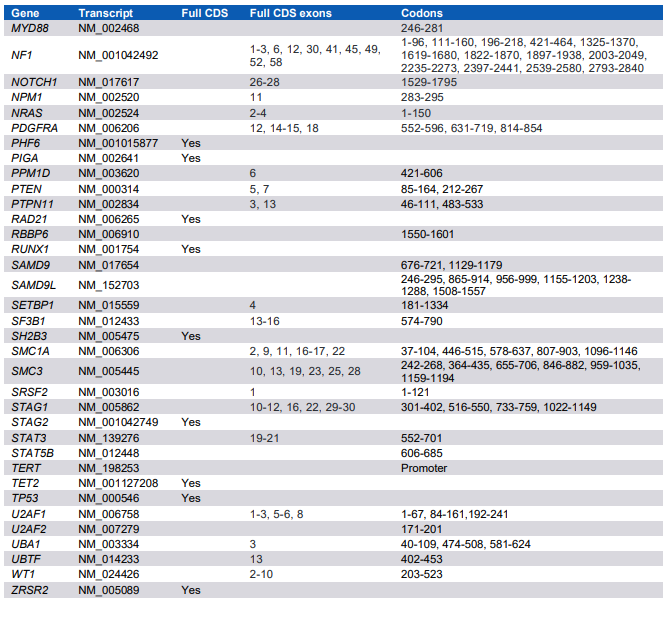
The associated PiVAT analysis workflow incorporates local realignment, paired-end read assembly, and a dedicated ITD detection approach designed to identify FLT3 ITDs (Figure 2). Detailed transcript, exon, and codon coverage is provided in the Detailed Panel Content section.
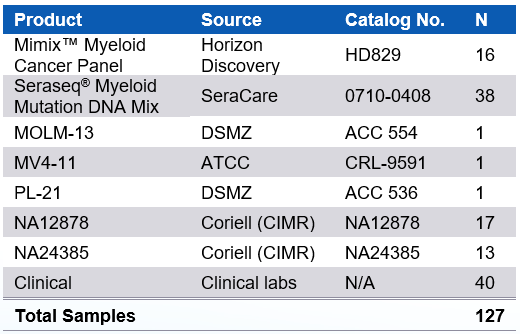
Table 2. Specimens analyzed in this Application Note.
Samples
Performance of the oncoReveal Myeloid v2 Panel was evaluated on 127 samples split across commercially available reference standards (Horizon Discovery and SeraCare), established myeloid cell lines (MOLM-13, MV4-11, and PL-21 cell lines), well-characterized genomic DNA controls from GIAB (NA12878 and NA24385), and through sequencing testing with clinical specimens by external collaborators (Table 2). Performance evaluation of the oncoReveal Myeloid v2 Panel assessed sequencing quality, coverage uniformity, analytical sensitivity across DNA inputs and serial dilutions, quantitative VAF agreement, and detection of challenging variant classes, including FLT3 internal tandem duplications. Reference standards were evaluated across multiple DNA input amounts and serial dilutions. GIAB and clinical specimens were used to assess sequencing quality and coverage performance across representative sample types. FLT3 ITD-positive cell lines and reference standards were used to evaluate detection of ITDs of varying lengths.
Panel workflow
The oncoReveal Myeloid v2 Panel uses Pillar Biosciences’ SLIMamp multiplex PCR chemistry investigating 874 amplicons in a single reaction. Following DNA extraction, targeted enrichment and indexing are completed using standard laboratory equipment, with approximately 3-5 hours of hands-on time and less than 8.5 hours of total library preparation time; flexible stopping points are included for users with time constraints. Prepared libraries can be loaded onto a compatible Illumina sequencing system on the same day. The single-pool workflow minimizes sample handling and avoids the need to divide limited specimens across multiple primer pools. PiVAT analysis subsequently processes each sample in ~3-10 minutes, generating annotated variant calls together with sample-, run-, and amplicon-level quality metrics.
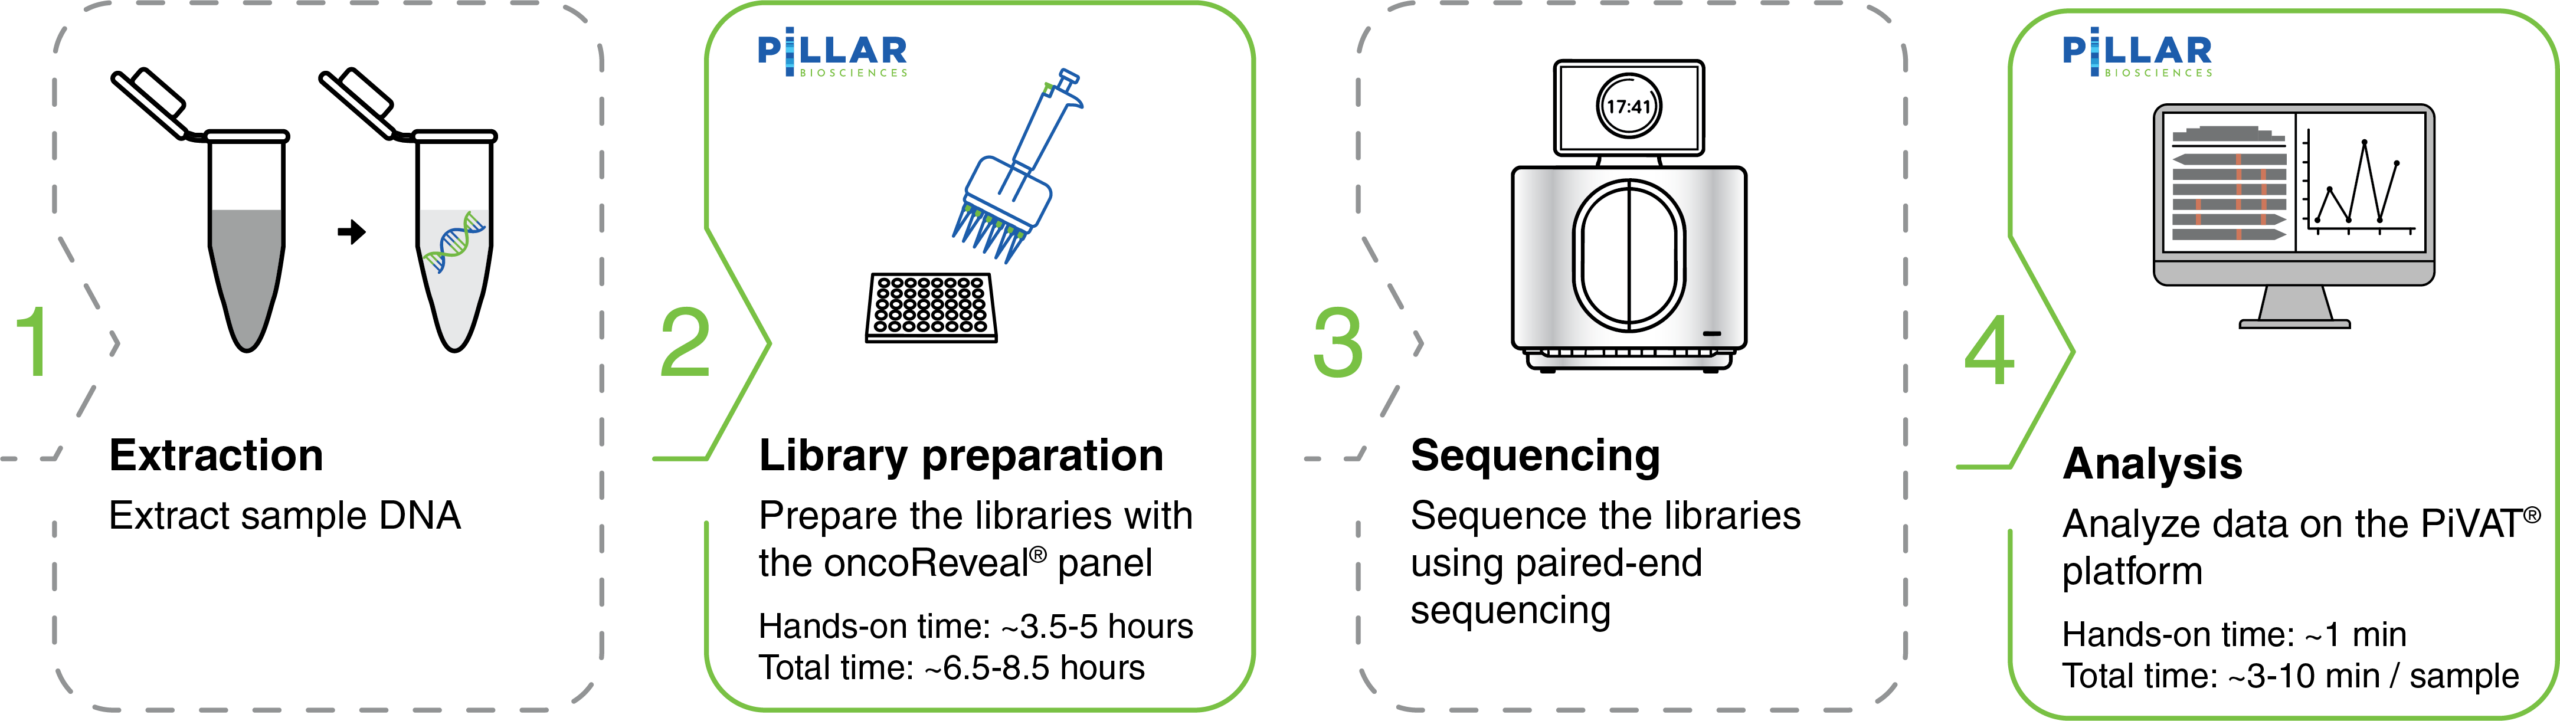
Figure 1. End-to-end workflow for the oncoReveal Myeloid v2 panel with PiVAT data analysis. The workflow consists of four sequential steps from sample processing to data interpretation. Steps highlighted in green (library preparation and data analysis) indicate components facilitated by the oncoReveal Myeloid v2 panel and PiVAT software. (1) DNA Extraction: Genomic DNA is isolated from input samples. (2) Library Preparation: Targeted amplification is performed using an oncoReveal Myeloid v2 panel. (3) Sequencing: Prepared libraries are pooled and sequenced. (4) Data Analysis using PiVAT: Sequencing data are processed using PiVAT, which performs local realignment to generate overall sequencing and mapping metrics, and accurate SNV/indel and ITD calls.
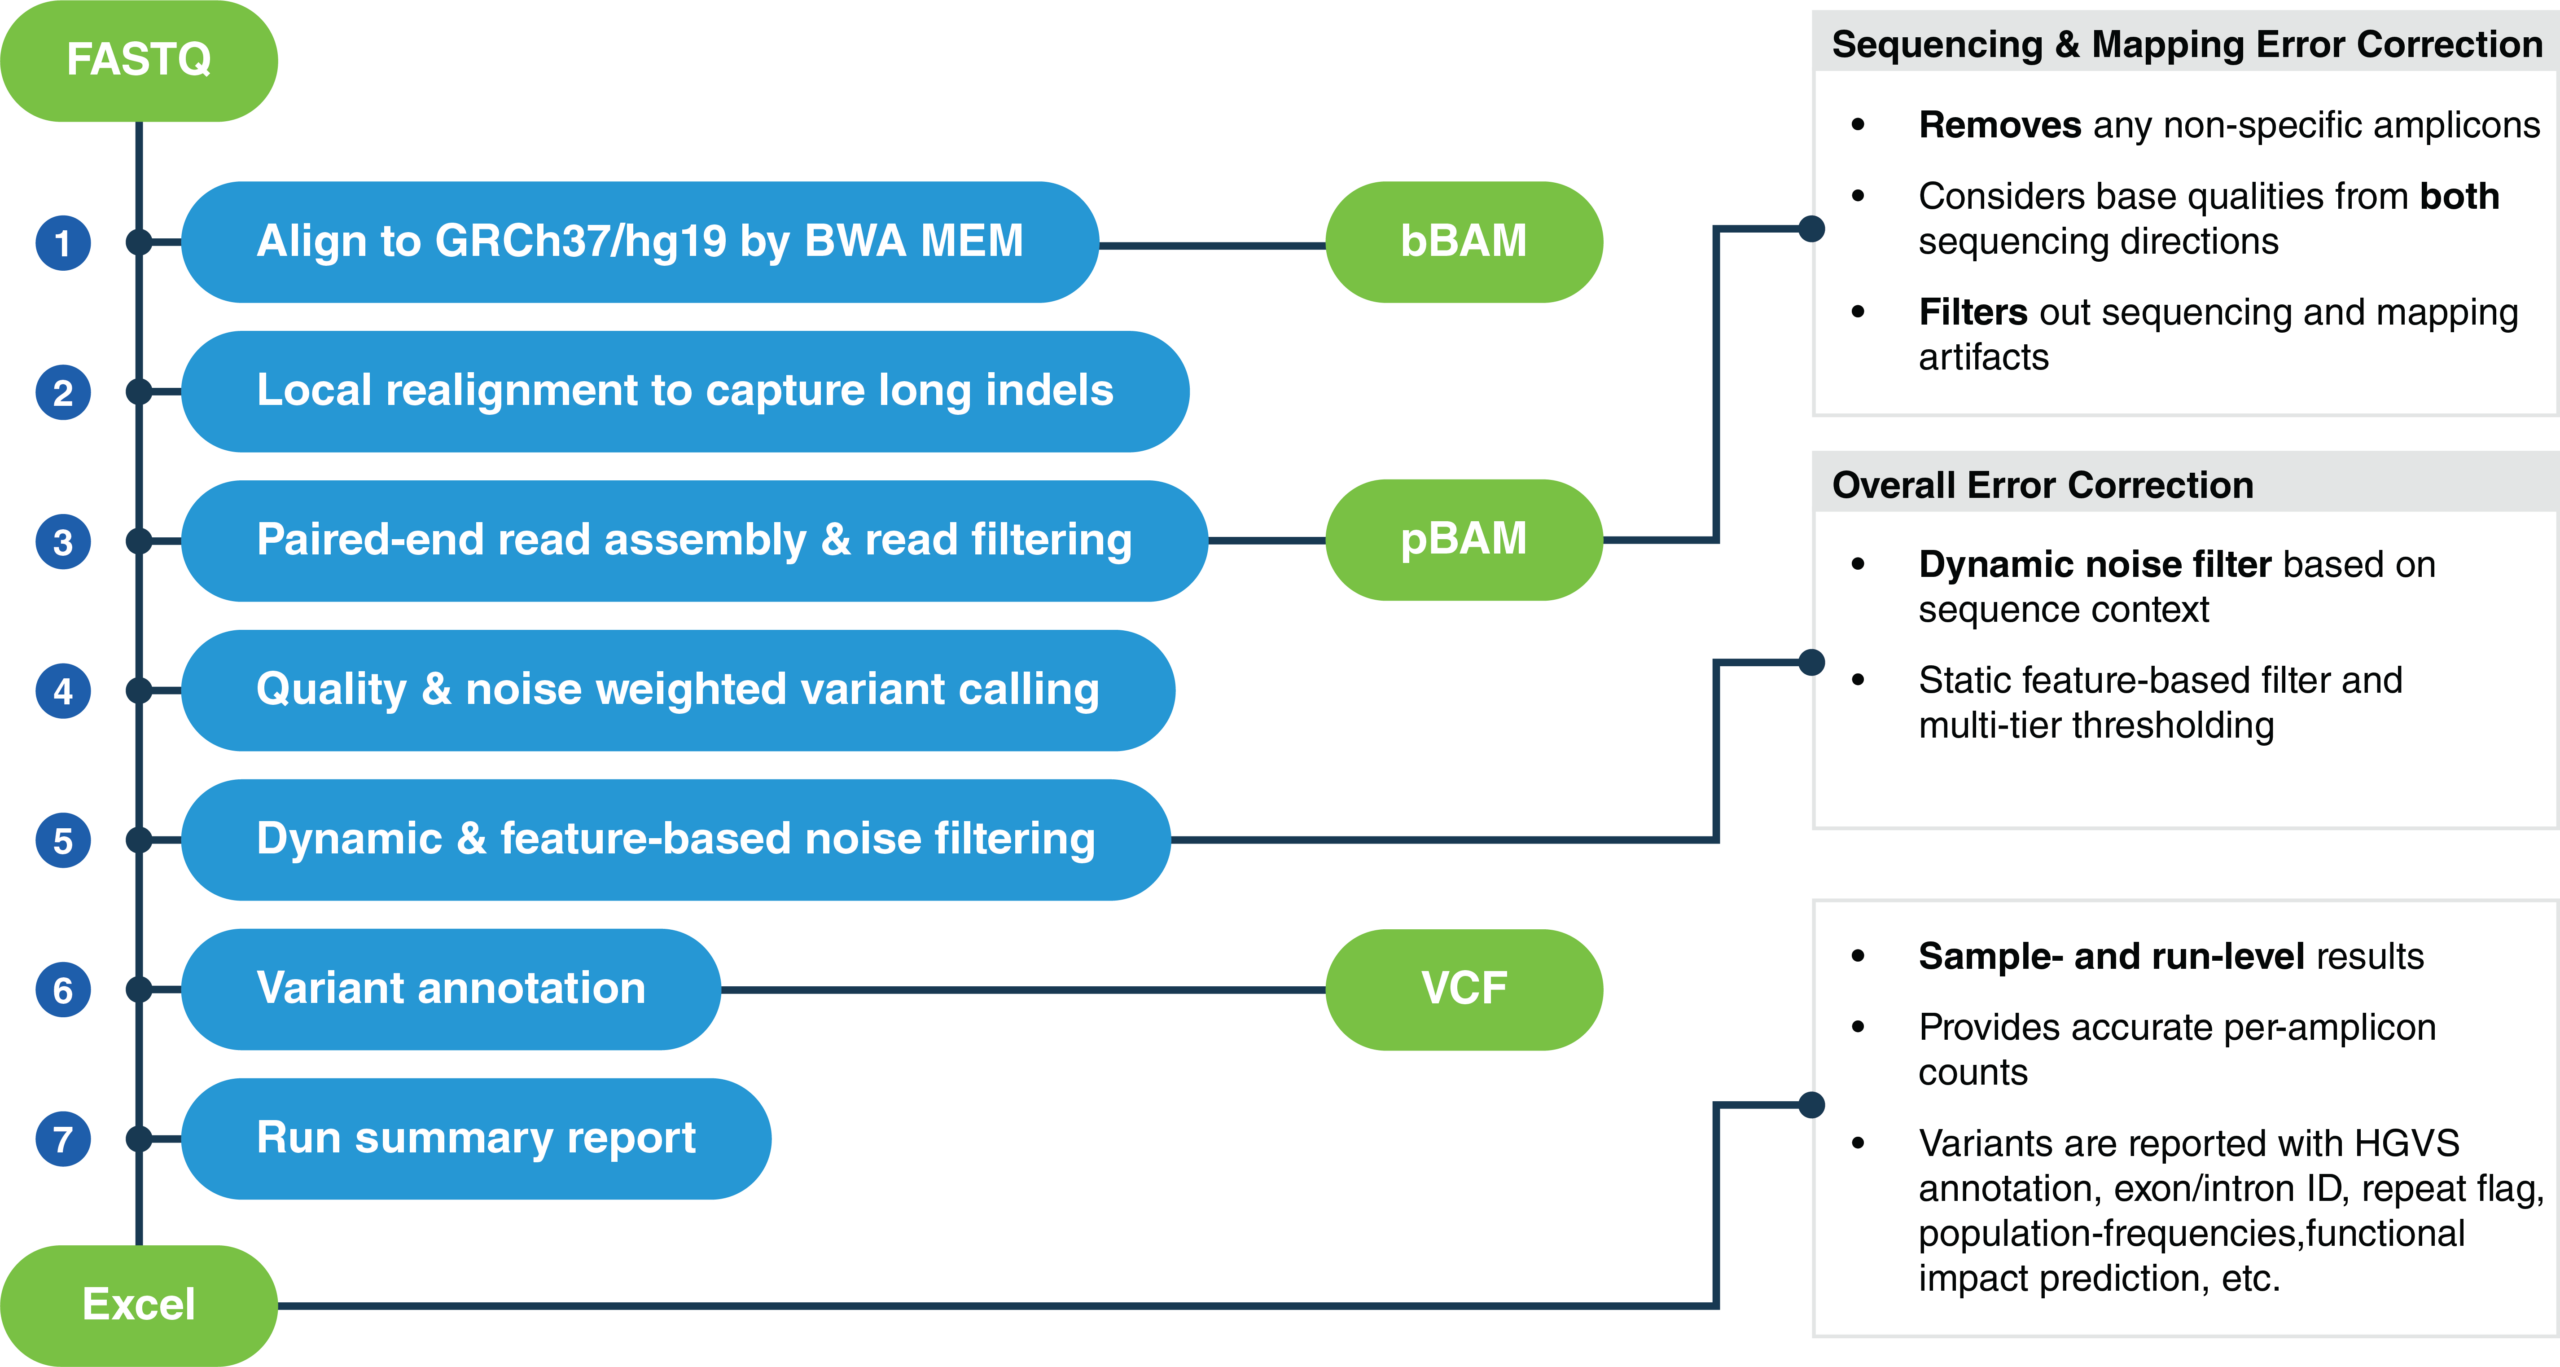
Figure 2. PiVAT analysis workflow for amplicon-based next-generation sequencing data. PiVAT implements a series of refinement steps such as local realignment, paired-end read assembly, and read filtering to improve alignment accuracy and enable robust detection of genomic variants including long indels. Multiple error-correction strategies are utilized for filtering noise, including removal of non-specific amplicons, bidirectional base-quality assessment, sequencing and mapping artifact suppression, quality- and noise-weighted variant calling, and dynamic sequence context-dependent noise filtering with complementary feature-based filtering. Variants are called with high confidence, and annotated and reported in VCF, while sample- and run-level quality control metrics, including per-amplicon performance statistics, are generated as spreadsheet reports.
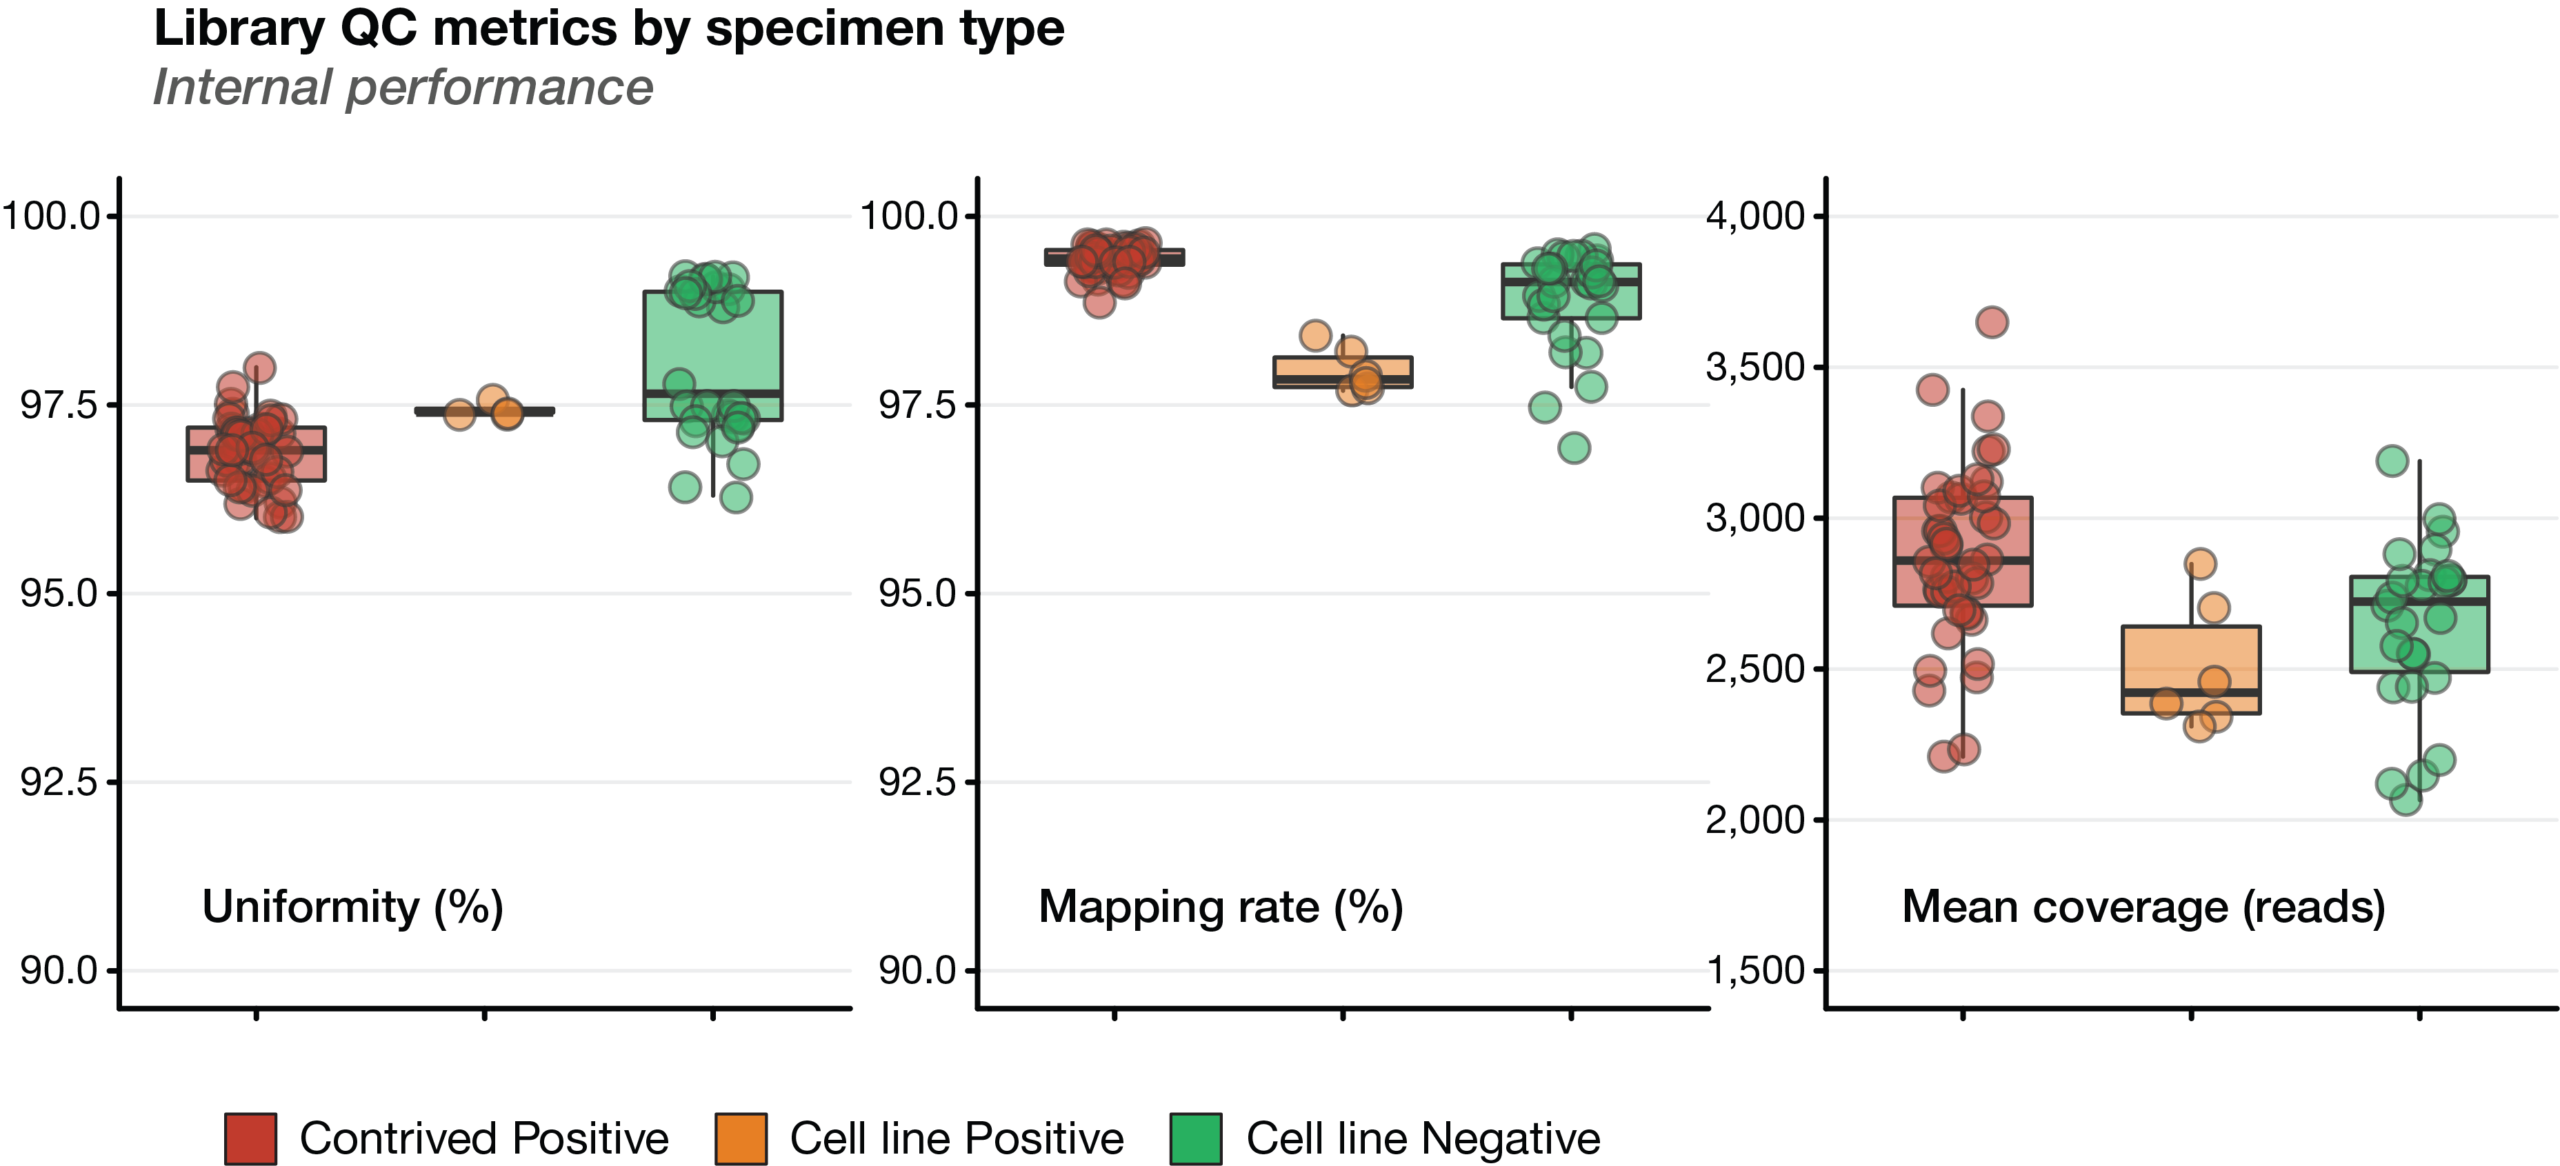
Figure 3. Library quality control metrics across specimen types (internal performance). Distribution of key sequencing quality metrics for contrived positive controls, positive cell lines, and negative cell lines. Boxplots summarize the median, interquartile range (IQR), and 1.5× IQR, with individual points representing independent samples. (Left) Library uniformity, expressed as the percentage of target bases achieving at least 0.2× the mean coverage. (Center) Mapping rate, defined as the percentage of sequencing reads aligned to the human reference genome (GRCh37/hg19). (Right) Mean target coverage (reads) across all panel regions. Reference standards and controls demonstrated high library uniformity and mapping rates, and consistent mean target coverage, indicating robust assay performance
Results
Sequencing reads from the oncoReveal Myeloid v2 Panel were analyzed using PiVAT version 2025.3. Briefly, PiVAT aligns sequencing reads to GRCh37/hg19, performs Smith-Waterman local realignment to improve indel detection, and merges the paired-end reads to minimize sequencing noise. Non-uniquely mapped reads, pseudogenes, and off-target amplicons are systematically filtered prior to variant calling. Candidate variants then undergo heuristic post-call filtering and run- and sample-level quality metrics are evaluated to generate an automated PDF and Excel reports.
Overall, high mapping rates (median >90%) and uniform coverage (median >95%) were maintained across specimen types, including the GC-rich CEBPA coding region. Serial dilutions of samples are tested to evaluate sensitivity and quantitative accuracy across supported DNA inputs and variant allele frequencies.
Sequencing performance across sample types
Internal performance assessment
All samples were evaluated for library uniformity, mapping rate, and mean target coverage. Mapping rates (Figure 3, left) and coverage uniformity (Figure 3, center) were consistently high across all groups, indicating high usable sequencing data. Mean target coverage (Figure 3, right) was consistent among specimen types.
Reliable analysis of CEBPA can be challenging because much of its coding sequence has exceptionally high GC content, which can reduce amplification efficiency and cause uneven coverage or target dropout in multiplex PCR assays. The tiled SLIMamp design of the oncoReveal Myeloid v2 Panel was evaluated across the complete study cohort to determine whether coverage was maintained throughout this difficult target. Median normalized coverage remained above the assay uniformity threshold across every amplicon, including regions approaching 90% GC content, with no evidence of amplicon dropout (Figure 4).
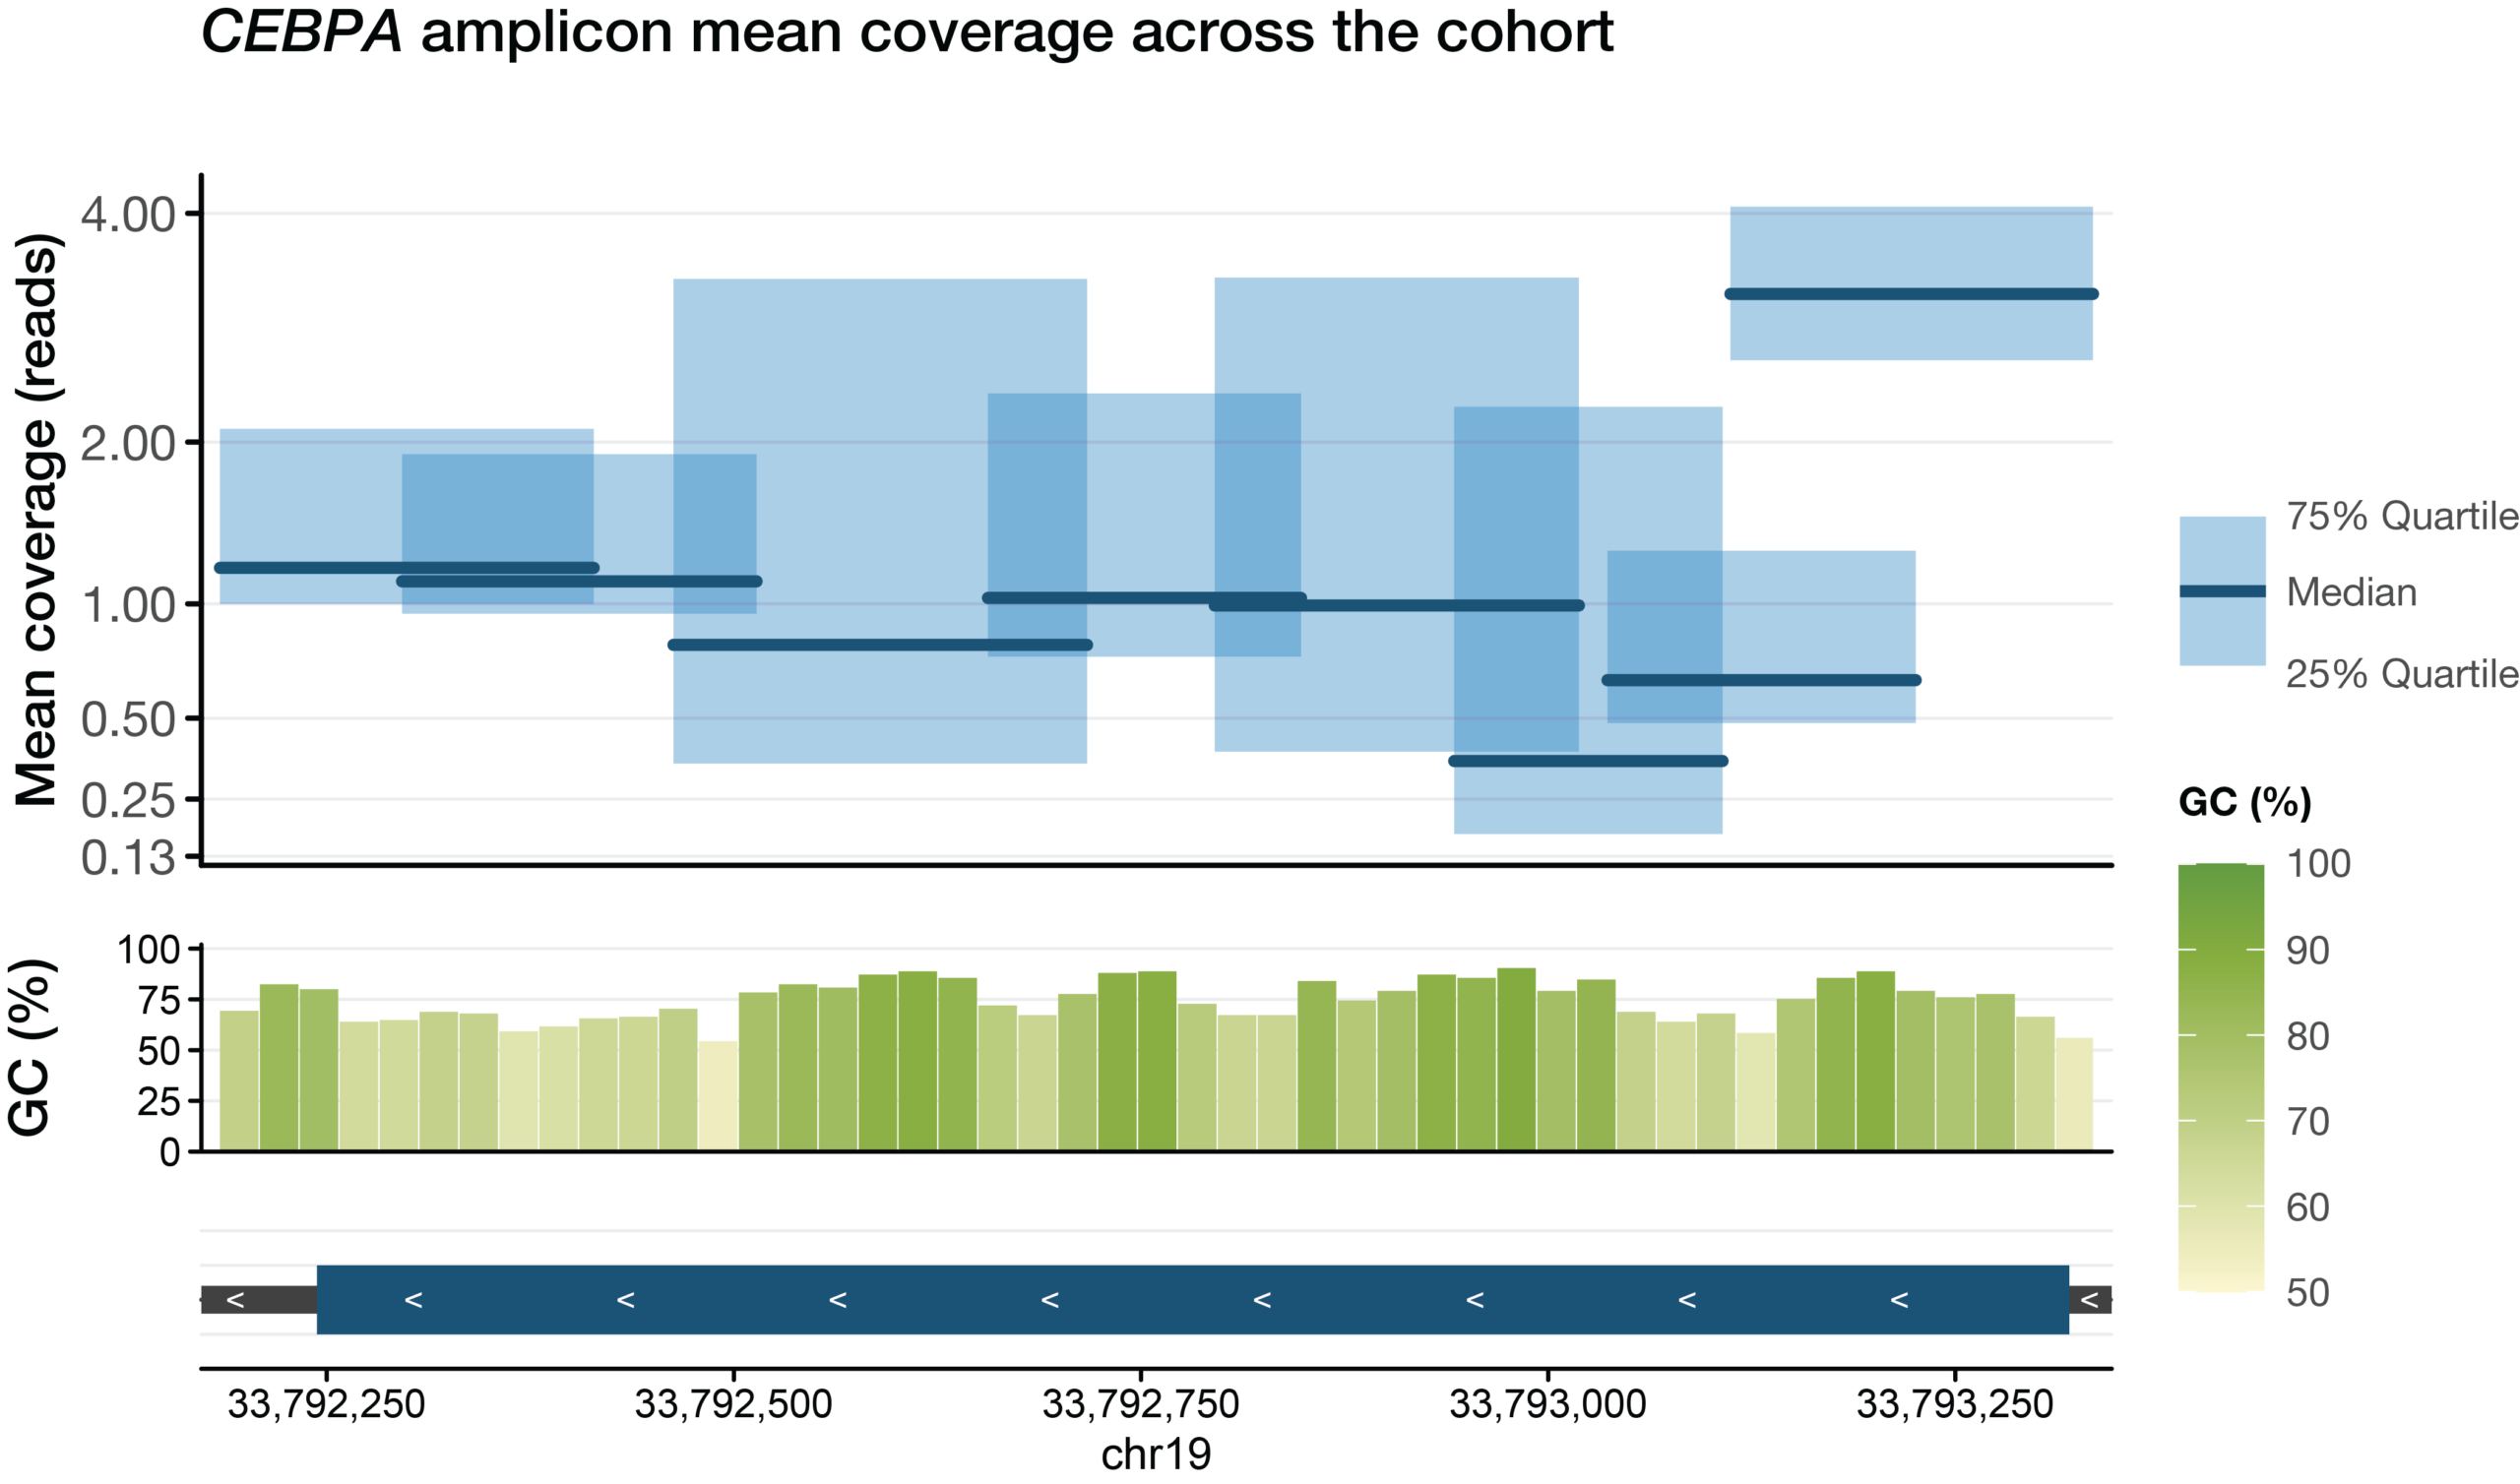
Figure 4. Uniform coverage across the GC-rich CEBPA coding region. Coverage uniformity for each tiled amplicon spanning the CEBPA coding sequence across the complete study cohort is shown. The upper panel shows the median coverage ratio (dark line) and interquartile range (shaded box) for each amplicon, where coverage ratio is normalized to the mean sample coverage. The middle panel shows the corresponding GC content across the targeted region. The lower panel depicts the genomic positions of the tiled amplicons across the CEBPA locus (GRCh37/hg19). Despite the high GC content and sequencing complexity of CEBPA, the assay achieves consistent coverage across the entire coding region with no evidence of amplicon dropout.
External performance assessment
Clinical specimens showed a wider distribution of mapping and uniformity values than the standardized control materials, reflecting the variability in real-world sample quality (Supplementary Figure 1, left and center). Mean coverage (Supplementary Figure 1, right) differed among cohorts due to differences in sequencing depth by different groups.
Sensitive detection across input amounts and serial dilutions
Analytical sensitivity was evaluated using Horizon and SeraCare myeloid reference standards containing SNVs, insertions, deletions, and FLT3 ITDs. The Horizon standard was tested at DNA inputs ranging from 5-60 ng. All expected variants were detected across every evaluated input condition, including a 300 bp FLT3 ITD. The SeraCare standard was evaluated at multiple DNA inputs and serial dilutions. At 20 ng input, all the expected variants were detected in the undiluted and 50% dilution samples. Sensitivity decreased at lower dilutions as expected variant VAFs approached or fell below the assay’s reporting threshold in PiVAT. At the 25%, 12.5%, and 6.25% dilutions, overall detection rates were 57.1%, 19.0%, and 4.8%, respectively. At the 50% dilution, detection was 94.4% with 10 ng input and 100% with inputs of 20 ng or larger. Notably, FLT3 ITDs were detected across most evaluated conditions, including several dilutions where many SNVs/indels fell below the reporting threshold (Table 3 and Supplementary Tables 1 & 2).
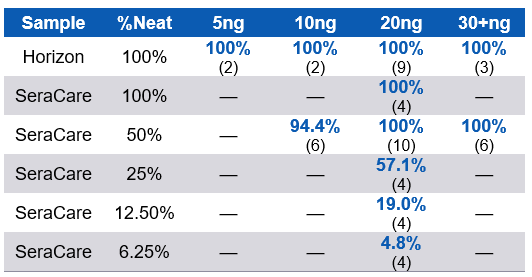
Table 3. Variant detection sensitivity across reference standards at multiple DNA inputs and serial dilutions. Horizon Discovery and SeraCare reference standards were tested across a range of DNA input amounts (5-60 ng) and serial dilution (“%Neat”). Values indicate the percentage positive agreement; numbers in parentheses denote the number of replicates analyzed. Cells containing a dash (—) indicate conditions that were not evaluated.
Accurate VAF measurement across the SeraCare dilution series
Quantitative accuracy was evaluated by comparing observed VAFs with expected values across serial dilutions of the SeraCare Myeloid Mutation DNA Mix (Cat# 0710-0408). The reference material contains variants with neat VAFs of approximately 5%, 10%, or 15%, allowing performance to be assessed across multiple variant concentrations and classes. Observed VAFs decreased proportionally with dilution, as expected VAF falls below the 2% cutoff threshold, and showed strong agreement with expected values across the evaluated series, with an overall Pearson correlation coefficient of 0.930. Variability increased at the lowest expected VAFs, as expected from stochastic sampling at low mutant molecule counts (Figure 5A). Observed VAFs for FLT3 ITDs decreased proportionally with dilution as well, with detection down to 0.625% for both the 42 bp ITD and 33bp ITD.
Summary
The oncoReveal Myeloid v2 Panel combines guideline-informed genomic content with a streamlined single-tube workflow for comprehensive analysis of myeloid malignancies. The assay targets 80 genes and supports detection of SNVs, indels, and FLT3 ITDs, including variants in technically challenging regions.
Across reference materials and clinical specimens, the assay maintained high mapping rates, uniform target coverage, reliable amplification of the GC-rich CEBPA coding region, accurate VAF quantification, and consistent detection of expected variants across supported DNA inputs. Same-day library preparation and integrated PiVAT analysis enable efficient implementation without increasing workflow complexity.
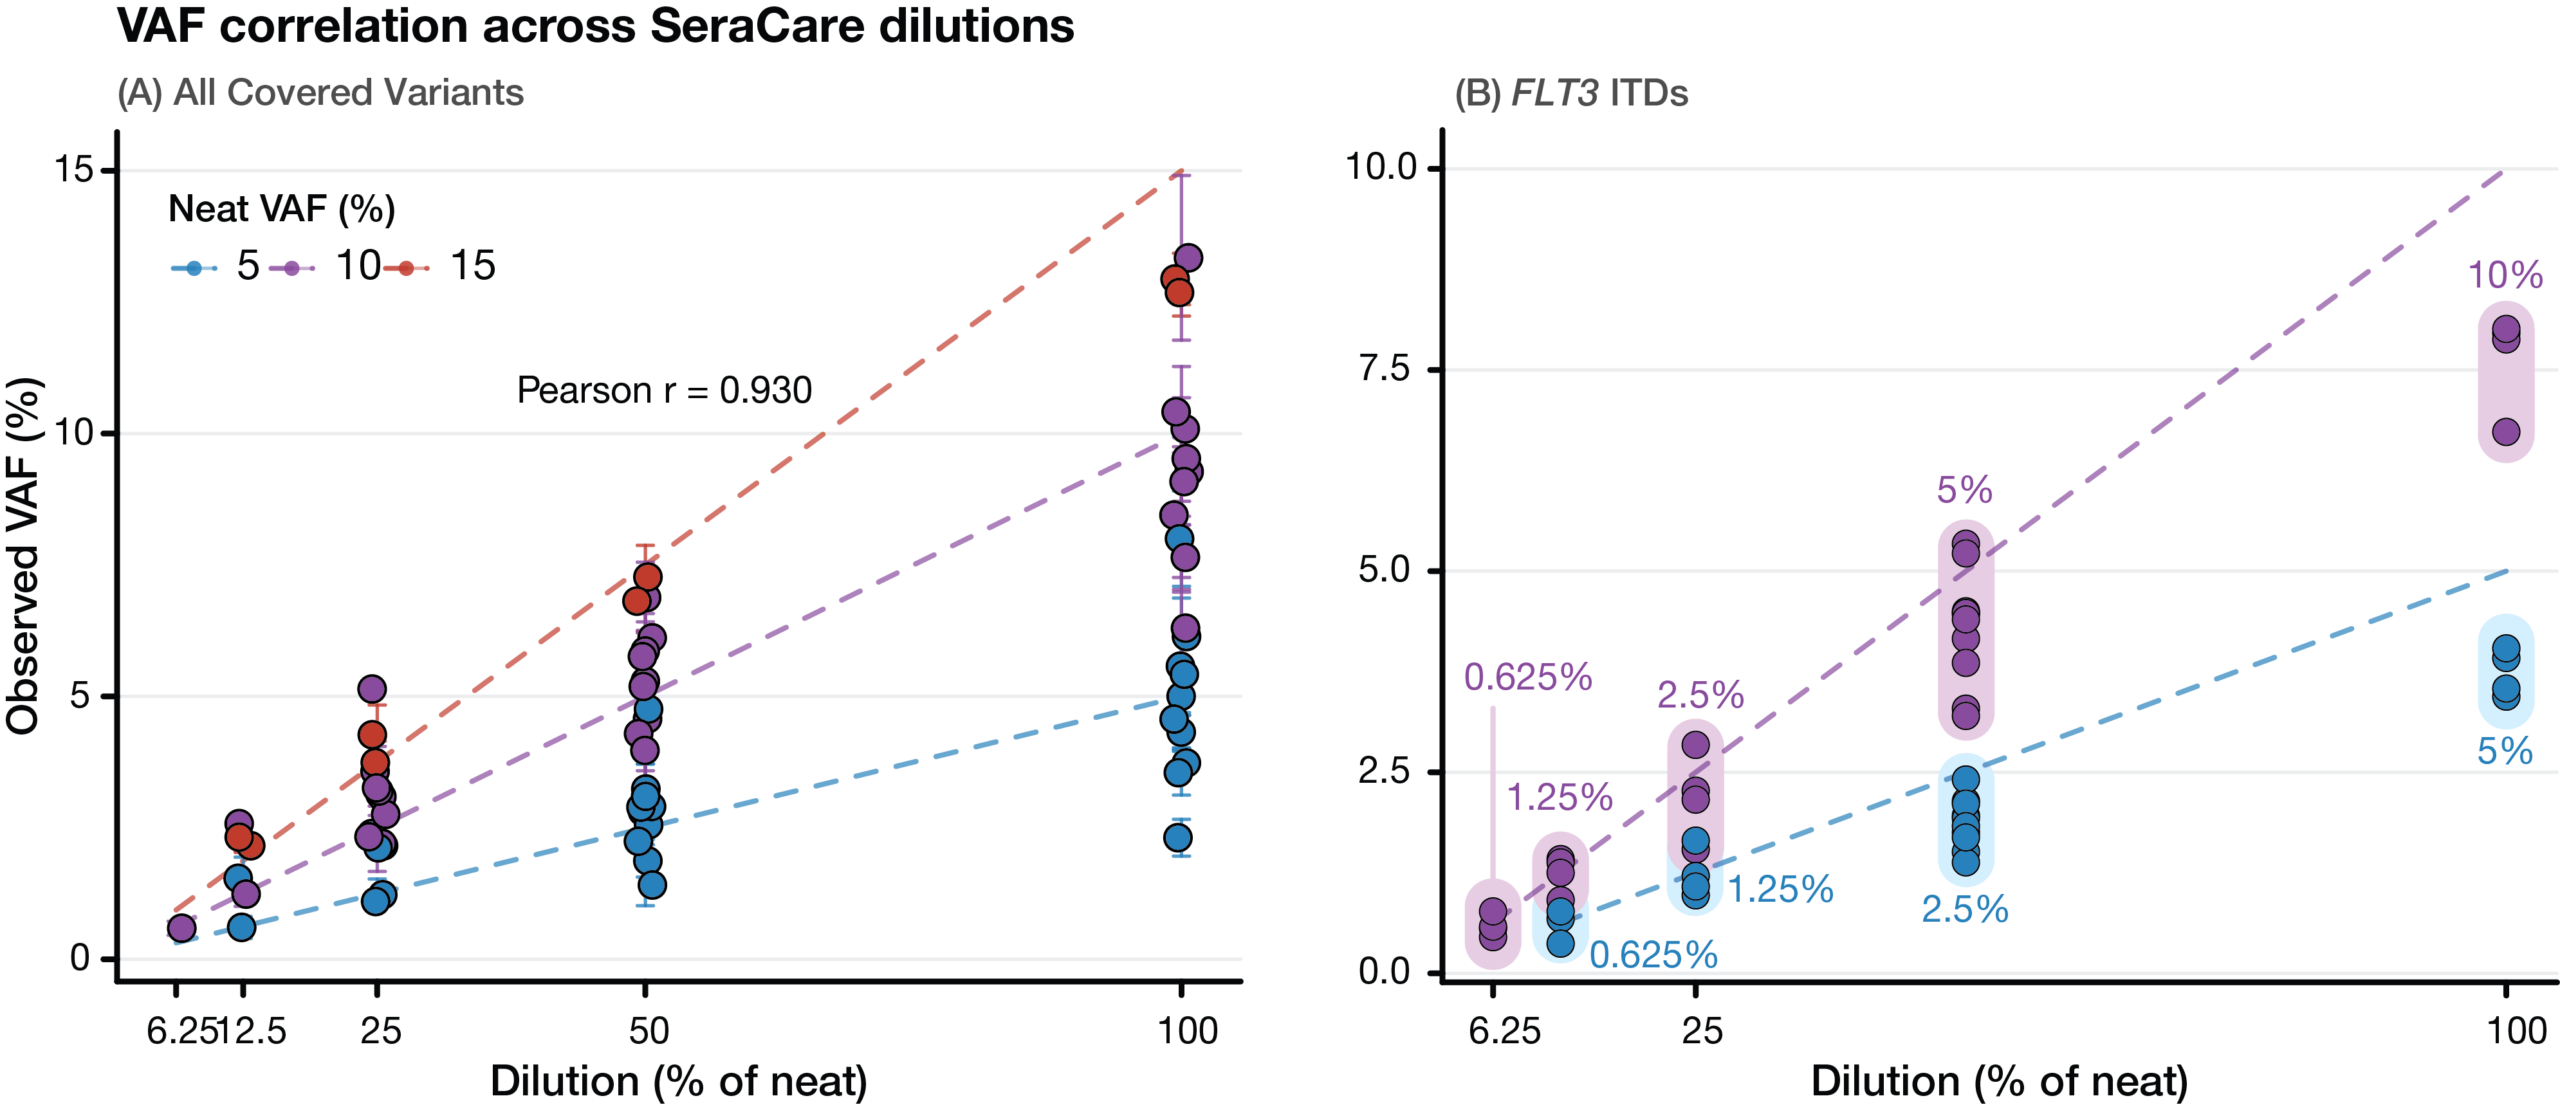
Figure 5. Variant allele frequency (VAF) concordance across SeraCare dilution series. (A) Observed VAFs for all variants in the SeraCare Myeloid Mutation DNA reference standard across serial dilutions. Dashed lines indicate the expected VAFs for variants present at 5%, 10%, and 15% in the undiluted material. Error bars represent ±1 standard deviation of replicate measurements. Observed VAFs show strong concordance with expected values across the dilution series (Pearson r = 0.930). (B) Observed VAFs against expected for the FLT3 internal tandem duplication (ITD) across serial dilutions. The blue and pink dots/line indicate the 42bp ITD (5% in neat) and 33bp ITD (10% in neat), respectively.
Supplementary Figures and Tables
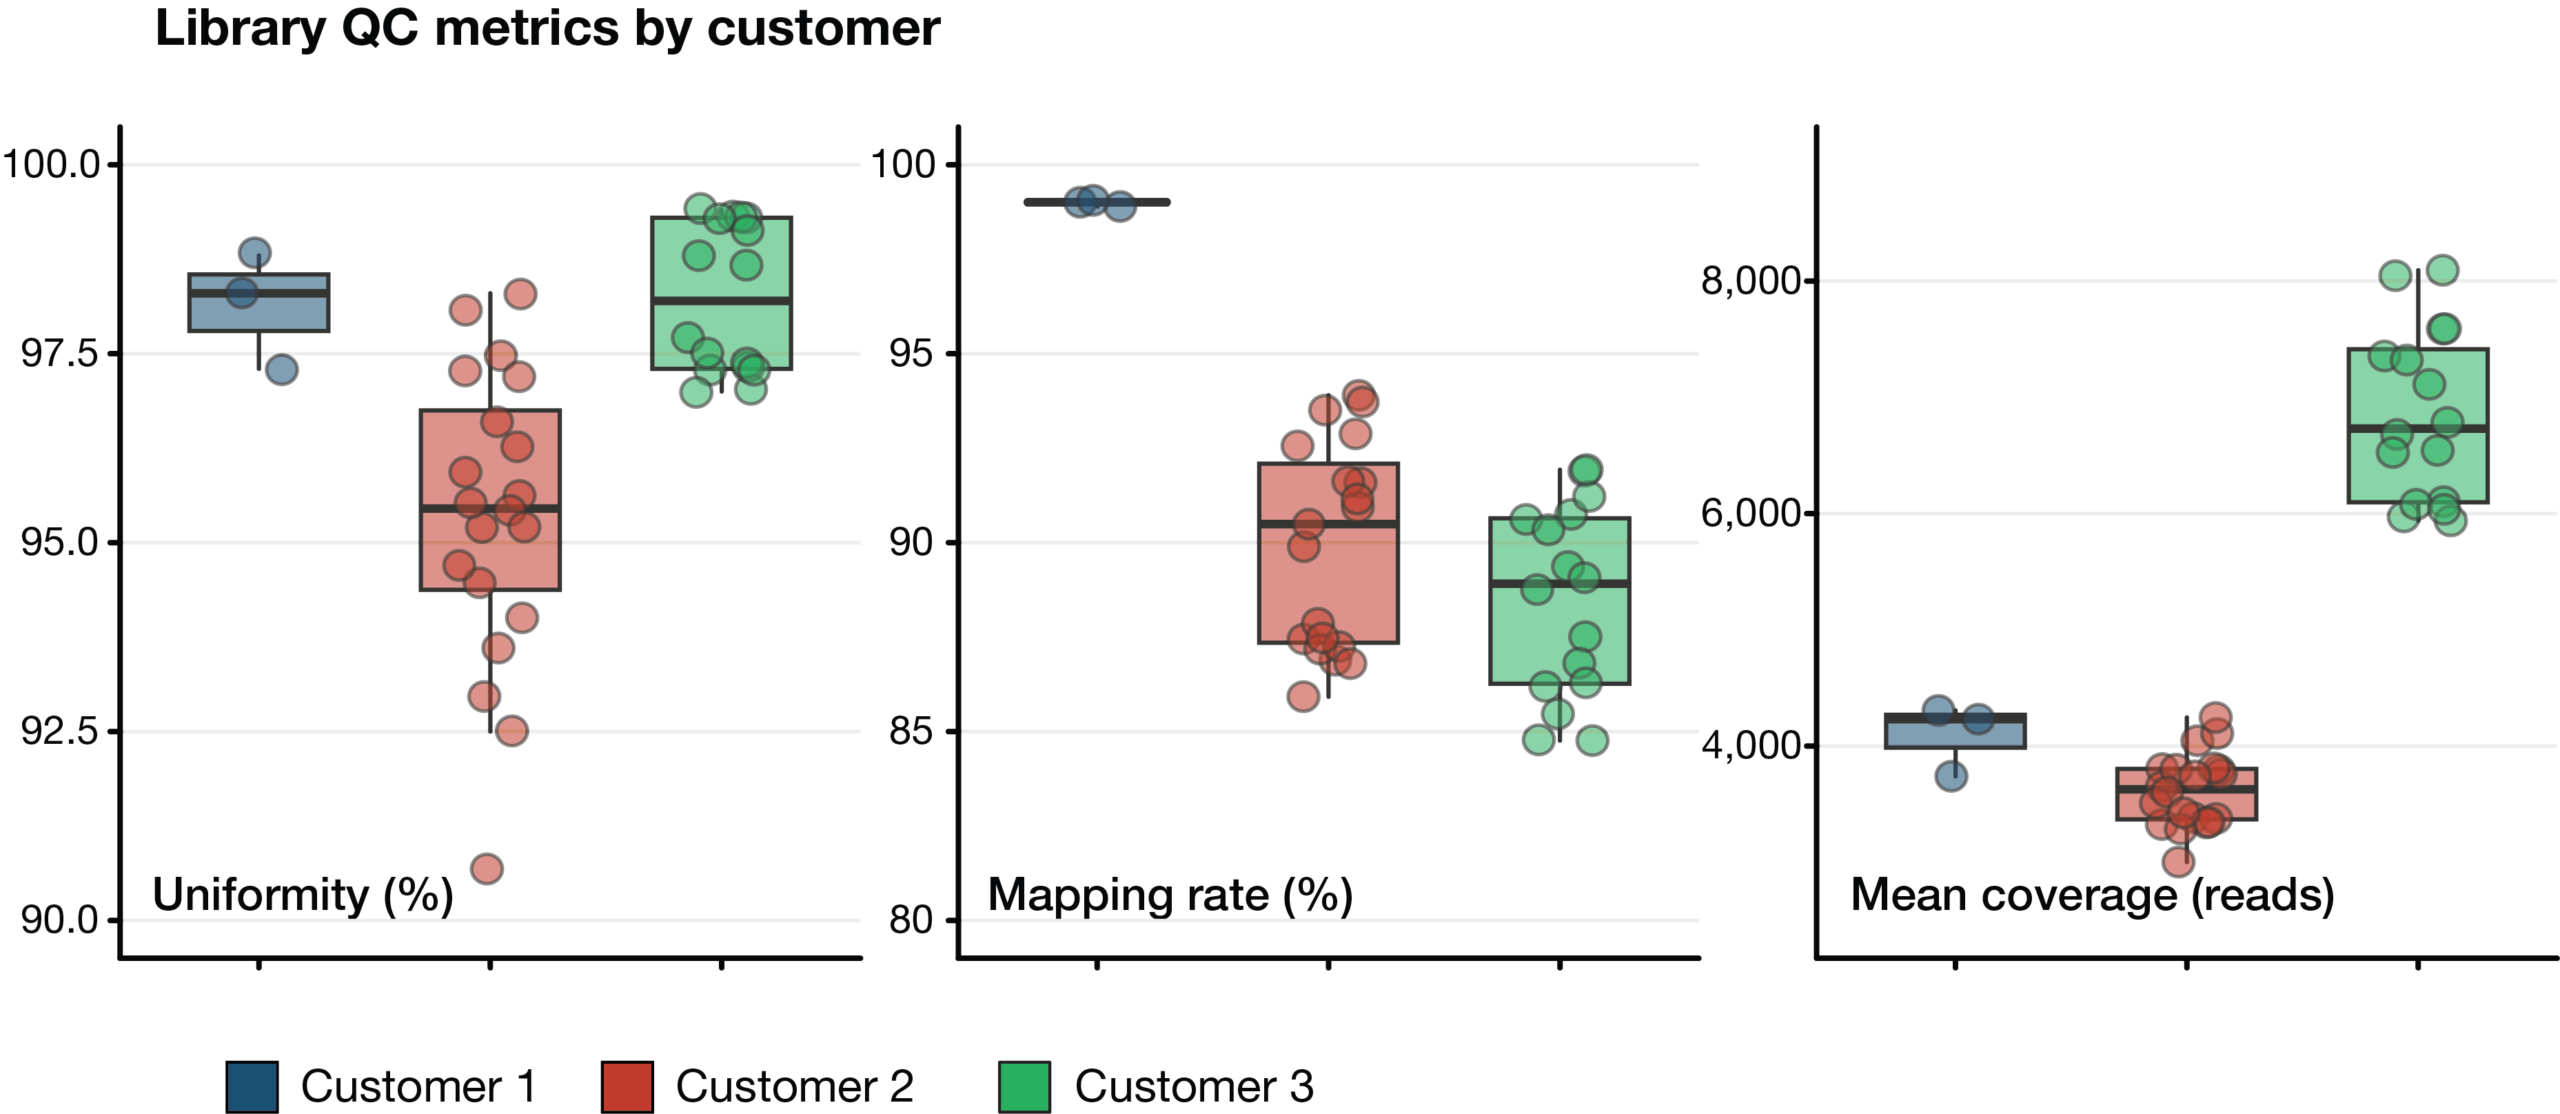
Supplementary Figure 1. Library quality control metrics across clinical specimens. Distribution of key sequencing quality metrics for clinical specimens, prepared and sequenced externally by 3 customers. Boxplots summarize the median, interquartile range (IQR), and 1.5× IQR, with individual points representing independent samples. (Left) Library uniformity, expressed as the percentage of target bases achieving at least 0.2× the mean coverage. (Center) Mapping rate, defined as the percentage of sequencing reads aligned to the human reference genome (GRCh37/hg19). (Right) Mean target coverage (reads) across all panel regions. All external data demonstrated consistently high library uniformity and mapping rates, indicating robust assay performance across diverse sample types, while differences in mean coverage primarily reflect variations in sequencing depth between sample cohorts. The clinical samples showed wider variability in sample quality, which is captured with the wider uniformity and mapping rate distributions.
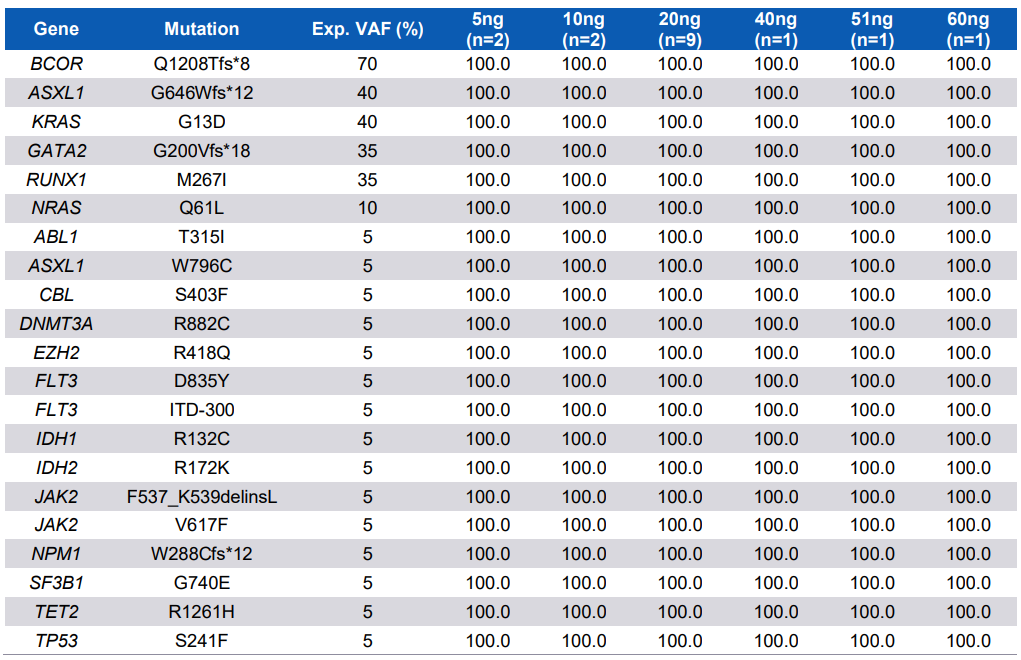
Supplementary Table 1. Assay Sensitivity on Horizon Samples (Mimix™ Myeloid Cancer Panel, Cat# HD829). All variants covered by the oncoReveal Myeloid v2 Panel were detected at 100% sensitivity for every input amount (ng).
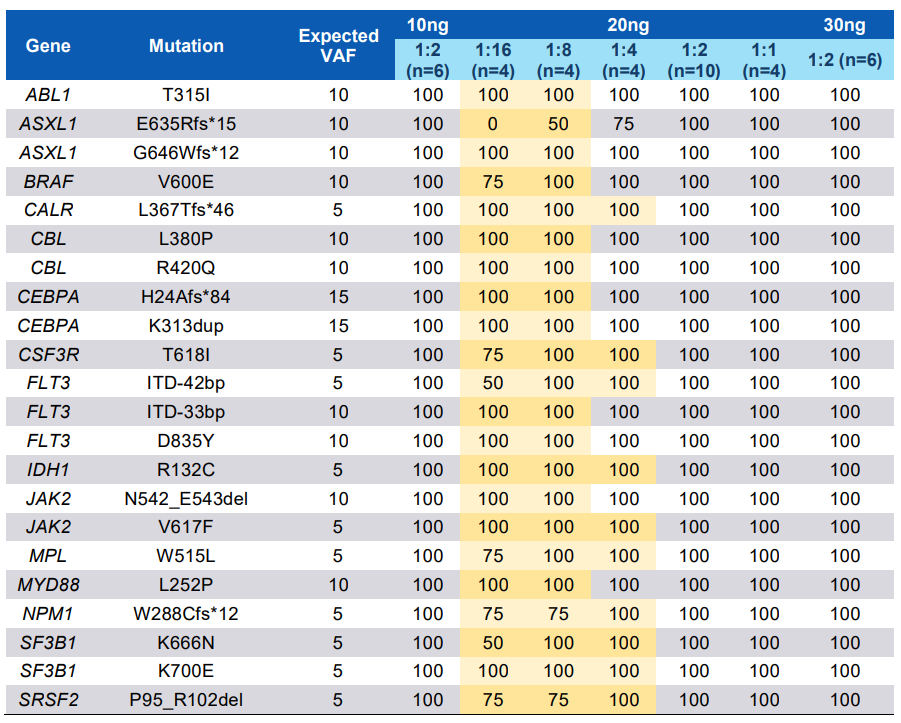
Supplementary Table 2. Assay Sensitivity on SeraCare Samples (Seraseq® Myeloid Mutation DNA Mix, Cat# 0710-0408). Values highlighted in gold are for dilutions with VAFs below the detection limit for the panel and were extracted from the PiVAT All Variant Report.
Detailed Panel Content
| Panel | Part Number | |
|---|---|---|
| oncoReveal® Myeloid v2 Panel (24 reactions) | HDA-MY-1010-24 |
| Pillar Index Kit Options | Reactions | Part Number |
|---|---|---|
| Pillar Biosciences Indexing Kit A | 32 Combinations, 96 Reactions | IDX-PI-1001-96 |
| Pillar Biosciences Indexing Kit D | 96 Combinations, 192 Reactions | IDX-PI-1004-192 |